Confessions of a Use-driven Consumer of Information Technology
For most teachers the passion of teaching comes from those moments in class when your students forget the formality of academia and unconsciously take charge of their own acquisition of knowledge. Long before all of this talk about the change of paradigm created by information technology became common, I subscribed to the motto: “Be the guide on the side and not the sage on the stage!”
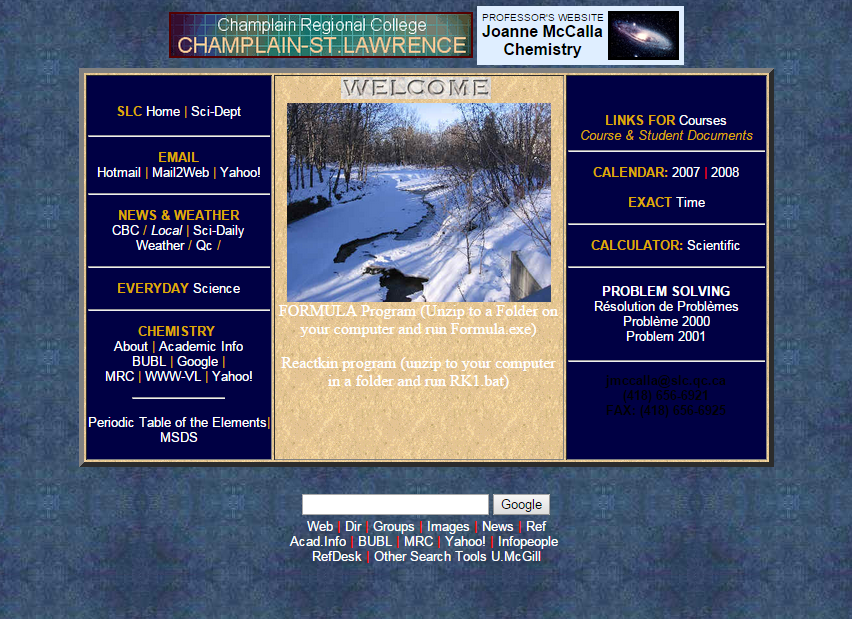
Joanne’s website home page
One of the fruits of this approach is a shareware “Reactkin” suggested by myself and developed by my colleague John Miller, now retired from the Physics discipline at Champlain Saint Lawrence. This software was born through my need to let students discover that reaction kinetics, the speed and variability at which chemical reactions occur, are an important indicator of what molecules are doing.
Students can play with the software to obtain charts that give the reaction kinetics according to the numbers and concentrations of molecules. If you vary the number of molecules or their concentrations as given in the software, you can easily see how the kinetics change. If you would like to see for yourself, you can download my software from my website and try it out!
I certainly won’t stop using balloons; they’re too much fun to give up!
Before Reactkin, there were balloons. No, that is not software. Balloons are those things that you blow up at children’s birthday parties. To simulate the actions of molecules, I asked students to blow up balloons, and then we played dodge ball. Students were one kind of molecules and balloons were another. We would record the time that it would take a certain number of students to hit another group with balloons. A student who was hit by a balloon was out. We would then change the variables and record the results. The figures were not always very accurate, but students would get the idea of how molecules react. The software Reactkin was the confirmation of their newfound understanding. I use a data projector so that the entire class can see the Reactkin portion of the process. In any case, I certainly won’t stop using balloons; they’re too much fun to give up!
You might want to visit my webpage (http://web2.slc.qc.ca/jmc/default.htm) which contains a link to a zip file created for me by our IT technician (Remy Garon-Santerre). The zip file allows our students to download another program called “Formula”, a drill program for inorganic nomenclature that was written many years ago by our physics technician Richard Gagne. This drill program is now used by all teachers of first semester chemistry. There are a couple of errors in the data base of formulas, for which I am solely responsible!! We may get around to fixing them some day. The webpage also gives information about my problem-solving method.
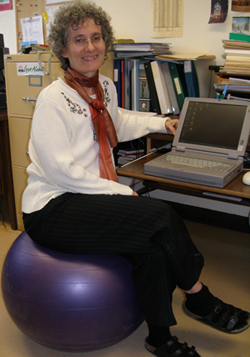
Joanne on her trademark exercise ball!
Although, I suspect I was unwittingly at the leading edge of the IT revolution when I helped to develop Reactkin, I certainly haven’t remained there. I am a use-driven consumer of information technology. When some chemical demonstrations could be graphed on Excel in real time during the class, the data projector was my friend. My students love being in charge of data entry for these little experiments. The most recent thing that I have needed from IT was a stylus to write on Powerpoint slides during presentations. I needed it, and I got it.
My colleagues and I are now considering integrating handheld digital measuring devices called interfaces into our chemistry laboratories. I feel that these tools will function to enable my students to further take charge of their own learning and allow me to be more of a guide and less of a sage.
As for Information Technology, there are a few things that seem certain:
- Students are more and more at ease with IT. Even a few years ago, we would have to make sure that everyone was functional using Word and Excel. This is no longer necessary.
- The teacher is not about to be replaced by a machine. Students will always need to interact with their teacher. I feel face to face contact is still the best way to achieve this.
- Digital technology has no permanence. We are living in a world where content can disappear as technology evolves. A 20-year old document created on an Apple computer is unreadable.
- I really fear for the future of our libraries. I see more and more students doing most of their research on-line. And yet books are a technology that has protected knowledge for centuries – we can still read documents written in 1608, which is a little longer than 20 years!
So this is a look into where IT fits into my teaching. Integrating technology need not be an all or nothing proposition! I’ve stood back and taken what I need from it. I won’t let it come between me and my students! In fact, IT becomes a bridge between us: we get to play games together in this new medium.
Author’s Update (April 7, 2008)
You may remember that I had a very old DOS program that simulated reaction kinetics. Well, it died this semester, and I was forced to try out an Excel version that John Miller wrote for me. I told you I was need driven! I thought you might be interested in seeing what he developed, because so far, it seems to be able to do what I need.
You can download these programs from the links below:
One of the versions is for classroom use. If you would like to see the versions that show a second order and a multi-step mechanism, let me me know!
The ‘program’ is a macro, so you must run Excel on low security (tools, macro, security). To indicate that reagent A is disappearing, you put a “-1″ in the cell below it; if it is appearing, you put” +1″. Likewise if 2 molecules re reacting, you use the number “2” instead of “1”. You put in a value for “k”, and for the initial concentrations that you want. Then you indicate the time that you want to run the simulation, like 1 second for example. Then you press Control-Shift-R, and the simulation runs. When it finishes, click on the tab at the bottom of the page to see the graph of concentration versus time. And that’s it!!!
