Renewing the Quantitative Methods Course by Anchoring it in Real Life
Since 2013, gradually, my colleagues Annie Turcotte and Steve Fortin, and I have reviewed in depth the way that we were giving the Quantitative Methods course.
We now give the class in an ALC (active learning classroom), and engage in activities based on problem situations anchored in real life. For one activity, we collaborate with local community organizations: the students utilise their competencies to respond to the needs of those organizations.
The result: the success rate of our students has increased significantly… and my colleagues and I love giving this class that repelled us before.
Necessary changes
Before 2013, at Cégep de Lévis-Lauzon, the success rate of the Quantitative Methods course, obligatory in the Social Sciences program, was around 60%. The classes were mainly based on lectures. The students worked with Excel in the computer lab around the middle of the semester and at the end of the semester, as a part of a long project. But the retention of the notions linked to the use of Excel was not satisfactory…
The inspiration
At the 2012 AQPC (Association québécoise de pédagogie collégiale) convention, my colleagues and I attended a workshop hosted by Hélène Beaulieu and Jocelyne Guénard, mathematics teachers at Cégep de Saint-Félicien.
Hélène Beaulieu and Jocelyne Guénard explained how they had transformed their Quantitative Methods course by using a classroom where the students could work as teams, each with a laptop. It was one of the first active learning classrooms in the collegial network. It allowed the students to use Excel nearly every class. Additionally, in their course, Hélène Beaulieu and Jocelyne Guénard were using problem-based learning to make the content more concrete and thus increase the motivation and the success of their students.
We communicated with Hélène Beaulieu who was generous enough to accept to send us, the Cégep de Victoriaville teachers, all of her teaching material. We would certainly not be where we are today without that generous sharing, nor without our collaborative work with the Cégep de Victoriaville teachers!
The problem situations
Instead of being largely based on lectures and focusing on Excel at only 2 moments, as part of a long project, we now make the students work with Excel nearly every class. Since our course is built on Moodle as 30 meetings, the students can structure their progression well and the transition to active learning is easier.
The meetings generally unfold in the following manner:
- At the beginning of the class, we see a little bit of theory.
- Then the students go in teams to work, each with a computer. They work on the laboratories with Excel, and then their problem situation.
Our course is structured around 3 activities during which the students analyse, in teams, a problem situation based on real or realistic data.
Here is, briefly, what the 3 problem situations of the course deal with:
- Analyse the chronological evolution of data. This can consist of:
- Calculating the measures of variation (variation, relative variation, average variation) of the number of inhabitants in the Province of Quebec and in a particular municipality, between 1996 and 2014, using data from the Institut de la Statistique du Québec. Then redact a comment presenting the demographic evolution of Quebec and the target municipality, a comparison of the 2 as well as an interpretation of the measures of variation of the number of inhabitants in Quebec and in the municipality.
- Studying the demography of a foreign country, using data from The World Bank. For example, analysing the use of mobile technologies in Congo.
- Processing the data (averages, standard deviations, etc.) and creating tables and graphs.
- Making estimations, analysing correlations. For example:
- Studying the different factors that influence the preparation of a person for their studies (level of education of the mother, family income, etc.).
- Studying the key factors of a healthy lifestyle.
In some cases, the real data is not available. For those situations, Steve programmed in VBA in Excel to generate, for each team, a realistic set of data that matched the content of the problem situation.
Working on real problem situations with, when available, real data goes a long way to raising the interest of the students and motivating them.
Before and after the ALC
In our first iterations of the renewed class, from 2014 to 2016, we did not have an ALC available in our college. We then gave the first hour of our class in an ordinary classroom, and the second one in a computer lab. Since there were no computer labs large enough for 40 students, the students were divided between 2 rooms and the teacher had to go from one to the other. Definitely not optimal conditions!
Since the end of the fall 2016 semester, we give the class in our college’s ALC. Each student has a laptop and they sit at tables of 4 students. It makes things significantly easier!
The collaboration with NPOs
For the last 2 years, I have been a member of the CEC (Commission de l’enseignement collégial).That is where I met Bastien Beauchesne, founder of Thulé Évaluation and chief scientist at Votepour.ca.
Bastien explained to me that he knew numerous community organizations (NPOs – non profit organizations) that were asking questions that could be solved through the use of quantitative methods. Many of those organizations do not have the means to answer those questions. The students of our courses can then prove very helpful! This fit very well with the notions linked with the 2nd problem situation of our course. At the start of the 2018 fall semester, Thulé Évaluation surveyed young people from the region to answer the needs of 5 NPOs:
- Votepour.ca
- the Unité régionale de loisir et de sport de la Chaudière-Appalaches
- the Forum jeunesse Chaudière-Appalaches
- the Forum jeunesse de la région de la Capitale-Nationale
- the FA COOP
During the presentation of the 2nd problem situation to the students, Bastien came in the classroom to talk with the students. He “sold” quantitative methods spectacularly well! He really managed to convince the students of the importance of quantitative methods “in real life”.
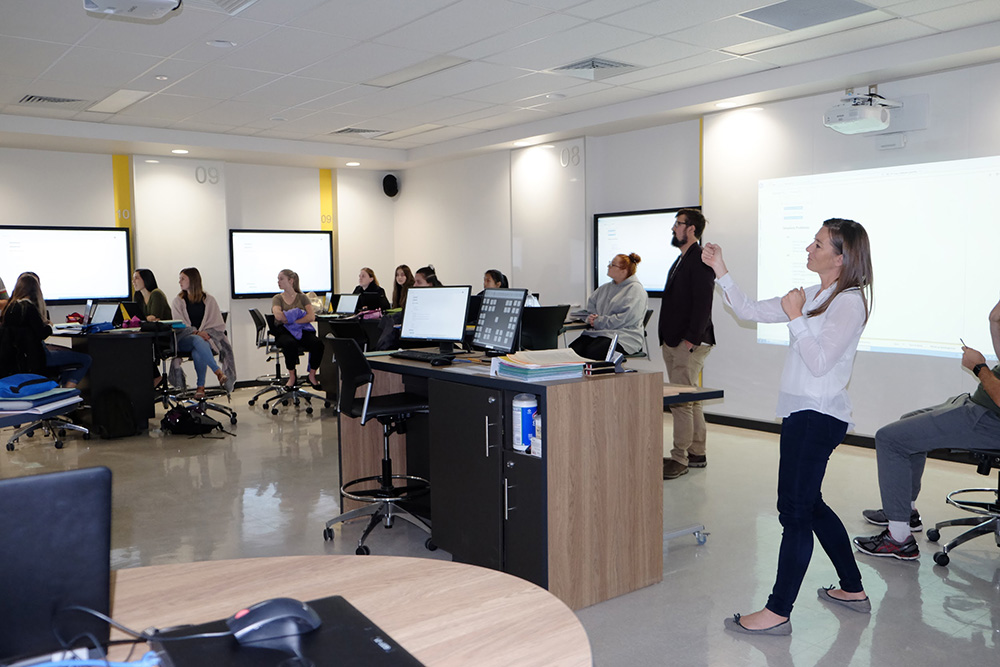
My students and I in the ALC, during the visit of Bastien Beauchesne (standing).
Then, each team of students chose, among the 5 organizations, the one that interested them the most. The students used the data collected during the survey done by Bastien in order to carry out quantitative studies that could be used by the concerned NPO.
Example of problem situation #2 (all resources are in French):
At the end of the project, some of the students presented the result of their work to representatives of the organizations.
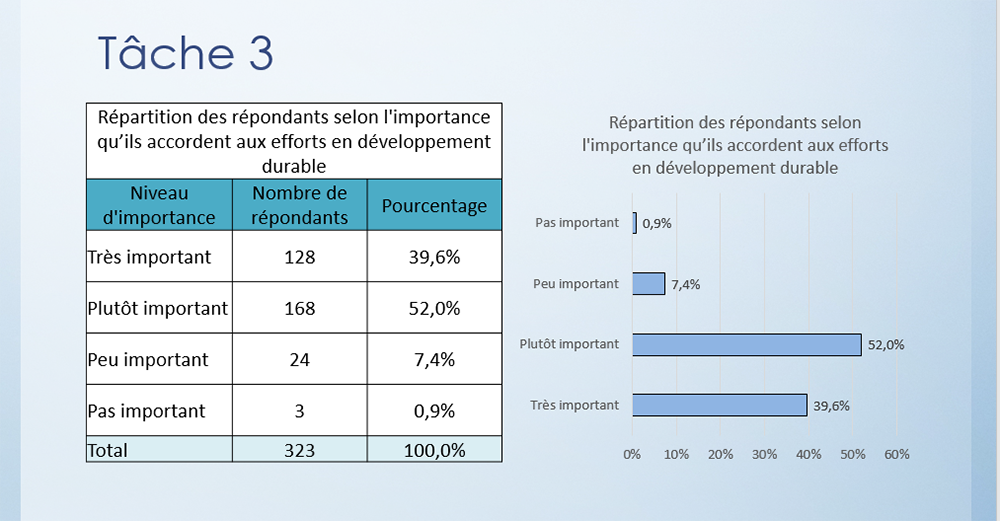
A slide from the PowerPoint presentation used by some students to present their results to the managers of the FA Coop. (Resource in French only)

Some students do a presentation in front of their peers and representatives of the Votepour.ca organization.
Certainly, this represented a lot of work for Steve and me, who were giving the course this semester. A written report presented to the NPO would clearly be easier to manage than an oral presentation at the auditorium, and we are considering that avenue for next semester.
The students loved the project that made sense for them by being concrete and anchored in reality. And the participating NPOs are very satisfied!
The Results
As a part of our transformation of the course, Annie, Steve, and I have asked ourselves many questions about all of the aspects of the class: the content, the targeted learning strategies, the pedagogical material, etc. It was extremely successful: the success rate of our students went from 60% to about 74%!
Before, I did not like to give the Quantitative Methods course. Now, I am disappointed when it is not on my schedule!
What’s Next?
From now, what I would like is for the other Social Science courses to get involved in the project, in the optic of a program approach. Obviously, I think first of the Initiation pratique à la méthodologie des sciences humaines (IPMSH) and, maybe also the Démarche d’intégration des acquis en sciences humaines (DIASH) course. And, beyond those courses, a sociology teacher, for example, could use data from the project to question their students (and inform the NPOs) on the reason why 71% of the young people surveyed did not vote in the 2017 municipal elections.
