TEPID – A warm entry into technology for development
The TEPID (Technical Education in the Promotion of International Development) Project was the genesis of a growing need to meld our students’ scientific acumen with their genuine concern for world affairs. Within the last five years, I have been conducting, with significant input from the McGill Chapter of Engineers Without Borders, a term project requiring the proposal of a technological solution to a specific development issue in a chosen developing country. Emphasis here has been placed on educating the student in bridging the social, economic and cultural gaps between donor countries in which the technologies are developed and taught, and the recipient countries in which the proposed solution is to be applied.
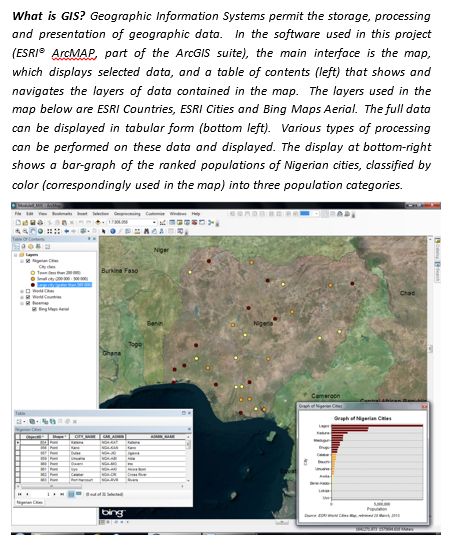
The TEPID project aims to take this one step further. Students, as a final phase of their project, will study and apply a specific technology suited to many development applications. Geographic Information Systems (GIS) software is now a standard tool in international development. Through support from the college with release time and from a SALTISE mini-grant to buy GIS software, I am now able to fully integrate GIS into our development project.
My goals for TEPID
My ultimate objective is to design a teaching unit that will equip our students for the field of international development through technology. My task will comprise two fundamental aspects :
- Understanding the role of technology in promoting development. This multifaceted issue is currently under study in collaboration with Jean-Michel Cohalan (Marianopolis, Geography). The value of Geographic Information Systems (GIS) software is recognized by developed and developing countries alike.
- Designing simple teaching modules to train my students in the use of GIS. This builds on other instructional modules (notably, by the CCDMD) for students at the CEGEP level. The goals of this exercise include the following :
- Extreme simplicity of presentation and ease of execution
- Engagement of the superior skill and familiarity of students with computers and the web
- The application of GIS as a development tool
Design of the GIS teaching modules
My final design currently consists of ten modules, each taking the student about fifteen minutes. The first module is a quick introduction to GIS. The next eight modules are basic tutorials that guide the students through key routines and terminology, ultimately leading to the acquisition of the skills necessary for analysis and presentation. The tenth module is a simple exercise requiring the student to propose an application of this program to a development goal in a country of their choice.
For simplicity, the modules were presented on printed sheets. A “tableau” of often-repeated functions and routines was also presented on a printed sheet.
Excerpt from a GIS Teaching Module
Testing the teaching modules
The modules were tried on twelve Science students. Testing consisted of four parts :
- Completing a brief pre-trial survey, stating their perceived level of computer literacy (five levels from novice to expert) and their personal interest in the project (if any).
- Undergoing trials with the teaching modules on one of two computers (Desktop or Laptop, each student used the same computer throughout) in two or three 75-minute sessions. Data were collected on eleven (five male, six female) of the twelve students: the first student was used to fine-tune the testing. The criteria used to evaluate student performance were (i) duration of each module, (ii) ease of performance and (iii) required level of teacher intervention.
- Performing “Module 10” requiring a proposal of a GIS-based development application.
- Completing a post-trial survey, requesting input (credit and criticism) of the exercise.
Results of module testing
The test results consisted of the data obtained during the testing, the feedback of the students in the post-trial survey, and my own observations.
Results from Student Testing
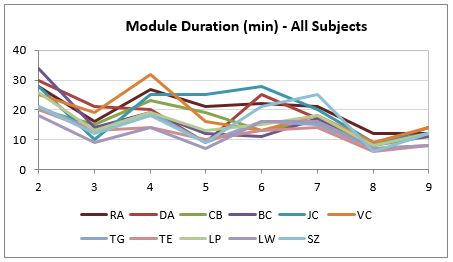
From the testing, it was found that duration was a fair reflection of the other two criteria (difficulty and required intervention). Modules took between five and twenty-five minutes, though the longest modules were consistently the same for all students, and all students appeared to exhibit greatest ease for the last modules. A closer analysis revealed no difference for gender or self-reported computer literacy. There was a noticeable increase (though less than 1 standard deviation from the average for all students) for those using the laptop, reflecting the difficulties noted below experienced by these students during the tutorials.Subjectively, the students reported general facility with the exercises and general satisfaction with and awareness of the use of GIS software. The largest specific difficulty was with users of the laptop, notably while attempting to use the touch pad (a known glitch with this laptop model). Other computer-related problems were rare. Intervention was mainly required only for certain instances of interpretation of the module text (again, consistent among subjects, and thus easily correctible) or for the needed geographic knowledge (such as finding London on a map of Great Britain, or understanding the notion of image resolution).
Finally, their performance on Module 10 demonstrated that they were easily able to take the next step of applying the software to international development.
Have you ever developed teaching modules for technological applications? What elements seem most important?
