Migrating to Excel in Quantitative Methods Courses with On-line Training Videos
For about 7 years I have been teaching Quantitative Methods in Social Science Research, a required course for Social Science Students that involves statistical analysis. With the rising cost of maintaining our software license agreement with a statistical package provider, the Methods sub-committee at our college decided to replace our prior solution with a more economical one, which required us to retool and retrain both faculty and students. We rose to the challenge and recently added a customizable on-line training video series that allows us to focus our valuable class time on teaching statistics and quantitative methodology – putting them into practice, rather than software training.
At John Abbott, as in many other colleges, Quantitative Methods is taught by teachers from a variety of disciplines that may have different ways of teaching the course. You may get a Business, Psychology, Political Science, History or Anthropology teacher, and we all put our unique mark on the course.
The Move to Excel
The Quantitative Methods course has a ministerial requirement for software to be used for statistical analysis. Traditionally, we were using PASW (SPSS), a well-known and widely accepted statistical package. At first, moving away from the PASW (SPSS) statistical package seemed like a daunting task, and the teachers felt a little overwhelmed with having to make a major change to their approach. During our analysis of alternate solutions, we found that the recent versions of Excel had a variety of statistical functions that we could use. We knew that a number of people were already familiar with Excel, which factored into our analysis. The fact that the software was already included in our campus license for Microsoft Office 365 and that students and faculty were able to download their own copies to install on their computers at no extra charge made the decision that much easier.
I was granted release time to create a guide for students and teachers on using Excel statistical functions.There are many steps involved in doing analyses and producing tables. Before we found a on-line video tutorial solution, we had to teach our students the basic functions of Excel. We had to demonstrate everything, showing students where to point and click, asking them to follow along, while trying to ensure that no one fell behind. All of this was very daunting. By week 2, most teachers were showing students how to organize tables and produce frequency distribution tables. All this took precious class time away from teaching the core material for the course. It became more like a computer class than a Methods course!
Since our job in Methods is to teach statistics, rather than teach software to our students, we needed to find a way to ensure that valuable class time would be spent on theory and application. I felt that there must be a better way, so I went to meet with Brenda Lamb, our IT Representative, in order to see how we might make the transition a little less difficult. She told me that John Abbott College had a site licence for the use of video tutorials from Atomic Learning, an on-line service that offered tutorials on a wide array of topics, including Microsoft Excel.
An On-line Approach to Software Training
Atomic Learning characterizes their solution as “an online professional learning system designed to meet the needs of today’s campus.” Their platform provides off-the-shelf video tutorials from a broad range of areas like college and career-readiness to student safety awareness. The Microsoft Excel training offered within Atomic Learning’s “technology use” offering was more relevant to our particular situation. They also offer the flexibility to add content that we create to their existing inventory. Teachers and students alike benefit from having access to these training modules.
A short excerpt from the Excel Training Series.
Integrating Atomic Learning has changed our approach to teaching. There are about 715 students and 11 teachers currently using the videos. The students have a link to a customized playlist of the videos that are relevant to our course. They can view videos like “What’s a spreadsheet,” or “What are columns and rows?” They find out about functionality like AutoFill and sort. These are all skills and information that they need to know before any statistical analysis can occur.
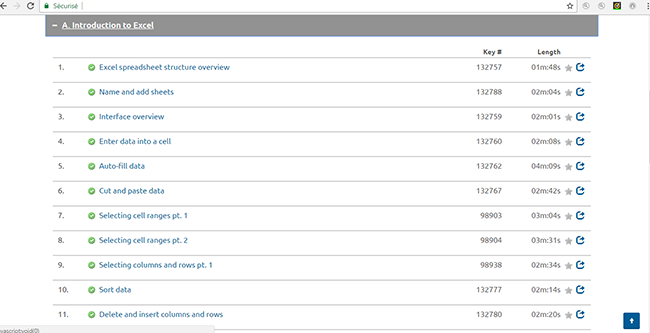
Some of the Microsoft Excel tutorials that are available to students.
The students are expected to watch the videos on their own. They can watch them in class with headphones and do things at their own pace. After viewing the videos, exercises in Excel can be provided to see what they have learned. This is the approach I have adopted, and it helps me to ensure that the students are doing the work. Other teachers are also adopting this strategy, but some assign viewing the videos as homework. Whatever approach is appropriate for each teacher, the students are able to access the videos from home and watch them as many times as they need.
Customizing Tutorials for Greater Impact
After we started using the “off-the-shelf” Excel videos we spotted some things in the Statistical series of videos that we wanted modified and we requested that certain videos be added. Atomic Learning’s representative, Dusty Nelson was always available and responded to us quickly in order to have these modifications and additions. He changed video names, resorted the videos according to the Methods course progression, and would upload documents to our space on Atomic Learning. We wanted to go even further, so Atomic Learning encouraged us to produce some of our own videos that were added to the platform. We used headsets and the Snagit recording software to produce these videos. Now we have some custom videos for descriptive and inferential statistics (i.e. graphs, cross-tabulation, confidence intervals) . There are more videos that we would like to add in order to have a complete series, and we will work on these in the near future.
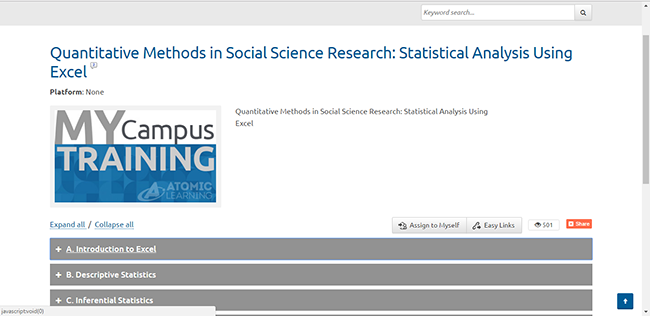
Customized landing page for the QM in Social Science Research videos.
Student Experience
We divide our week between the classroom and the lab, with about 2.5 hours in the classroom and 1.5 hours in the lab (each group is split in two, and these sub-groups are in the lab at different times). We spend our time on applied learning in the lab and have the ability to talk about broader concepts. Since we are not spending close to an hour showing students how to set up a table in Excel, we can spend more time addressing conceptual difficulties with the material, helping students develop good research questions and hypotheses, making sure they understand when to use the various statistical tests, etc. Course assignments are distributed to the students, and once they are comfortable with Excel, they can start working with the datasets.
Our adoption of the Atomic Learning videos for Excel is still a work-in-progress. We do not have videos for everything we need yet, but students have told us that they really appreciate the videos, instead of receiving printed documents with 14 steps. They are very comfortable with videos and might even watch them up to 10 times if they need! Sometimes students feel overwhelmed with statistics, and the videos go a long way to help them feel more secure. They can work at their own pace and they always have access to me to help out if they get stuck.
The students seem to be progressing at the same pace, and those students who need a little more time for the material to sink in do not feel the pressure previous groups might experience due to the fast pace of the class. Even for those students that watch a video in class and “don’t get it,” they can go home, watch the video again and not feel insecure. One student who had failed the course on a previous attempt, but passed the course recently even told me that if they had the videos before they might have passed the first time!
Looking Forward
The Fall semester of 2016 was the first time that we were required to use Excel. When we first started using Atomic Learning videos, it began as a pilot project with around 300 students. Now, for the first time in the Winter 2017 semester, all the Methods teachers are using the Microsoft Excel series from Atomic Learning in their classes, with around 700 students. Not all the teachers were confident in their level of mastery of Excel when we began the transition, but with the video tutorials they feel much more confident.
While we are waiting to receive feedback from teachers to see what they want to add for upcoming semesters, we hope to continue producing the videos that we still need for our students. I foresee that we will also be using tutorials on Word (for formatting tables), and PowerPoint, since the students are not always familiar with how to use this presentation tool, or to get the most out of all its features. We may even have students look at the Atomic Learning modules on APA citation style. All of these skills are important to Social Science students. As for my own use of Atomic Learning, this semester I will be numbering and ordering our videos on our Atomic Learning site to help make the videos I want the students to watch more explicit.
Looking forward, one thing’s for certain, my colleagues and I will not be going back to the old method of providing “point here, click there” software training to students for the whole semester in the lab!
Are you using video tutorials to supplement the learning in your course? We would love to hear about your experience in the comments area below!
