Can mathematics be useful for analyzing movements in physical education? Yes! That’s what I had the opportunity to show students by collaborating with Ariane Crépeau-Rousseau, a physical education teacher.
From September 18 to 22, 2023, the Collégial international Sainte-Anne organized the 2nd edition of the “Interdisciplinary Week” (Semaine de l’interdisciplinarité). During this week, there are no classes. Instead, the college relies on the creativity and leadership of its teachers to organize activities demonstrating the interconnections between disciplines. Students are required to participate in some of the activities proposed.
Studying movements in sports
In collaboration with physical education teacher Ariane Crépeau-Rousseau, I proposed a workshop called “Study of Body Movement in Sports” (Étude du movement corporel dans les sports). This workshop aimed for students to practise a common movement in a sport and analyze it. Here are some examples of questions participants tried to answer:
- Which team member throws the football the fastest?
- In badminton, which service technique allows you to serve the birdie the fastest?
- Is it better to hit the volleyball higher or lower for optimal speed?
The students filmed themselves in action with the help of a peer. To maintain the same reference point throughout the study, they had to make sure the movement was two-dimensional, facing the camera, and within a fixed frame.
A video I filmed myself, following the style of those made by the students.
Each team had a measuring tape to measure a reference object visible in the frame of the image (a park bench, a wooden plank, etc.). Knowing the length of this object then allowed the students to calibrate distances in the image.
The students used the Tracker software. They could install it on their personal laptops or use the online version, which is less efficient and prone to bugs depending on the platforms.
The students tried their best to keep the parameters of the experiment constant, ideally varying only one. For this reason, most video clips were filmed indoors.
Using Tracker and GeoGebra (or Excel)
The people registered in the workshop imported their video into the Tracker application in order to study it in detail.
Importing a video into Tracker
In Tracker, students used the reference length to calibrate all measurements taken, using the video sequence.
Defining the reference length to calibrate the measurements
Next, students placed their coordinate system (x and y) on the video. Then, they tracked the object studied (the ball, for example) in each video. (The online version of Tracker offers an artificial intelligence tool to automatically track an object, but students tested it without success.)
Through tracking, the students obtained the coordinates of various points: time, the position in x, and the position in y. Then, they transferred these coordinates in GeoGebra or Excel to determine, using a statistical tool, the equation of motion (often a “quadratic” regression due to the impact of gravity on vertical motion). Students repeated this step for each of the videos.
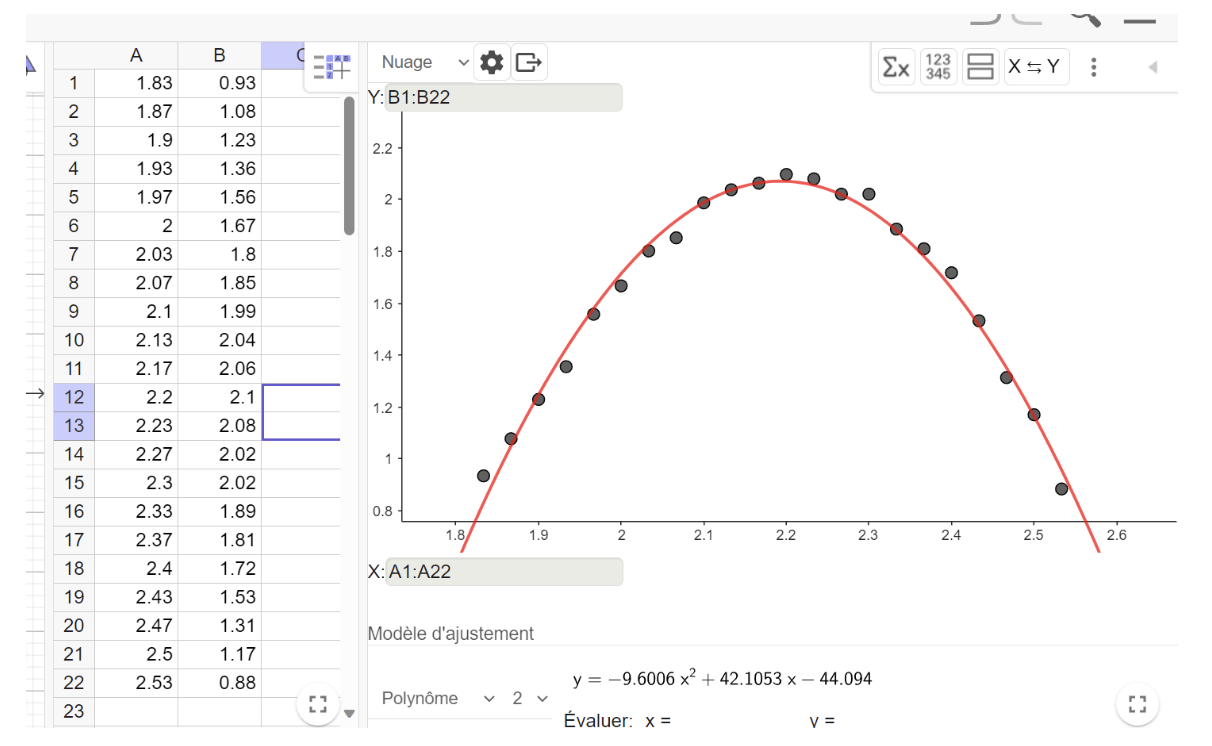
Screenshot of the graphic created in GeoGebra. The different points on the graphic correspond to the measurements of the ball’s height that the students took using a video. The red curve was generated by GeoGebra and represents the height of the ball over time. The equation of motion is written underneath the graphic.
Once the equations were found, the students had no difficulty understanding that calculating the derivative of the functions led them to their objective. They simply needed to define what they were looking for: the 1st derivative refers to the velocity; the 2nd derivative refers to acceleration. Searching for the moment when the derivative equals 0 helps find the optimum points of the curve.
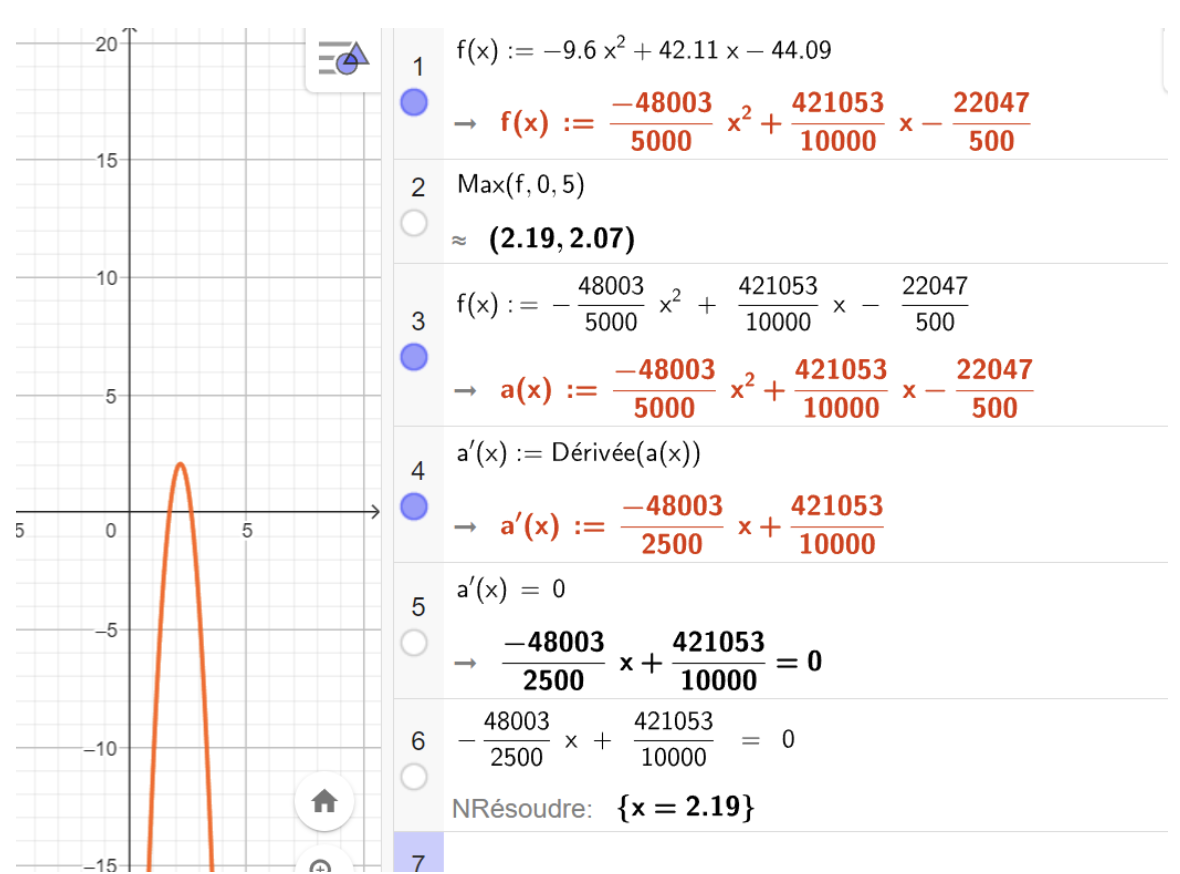
The identified curve is integrated into GeoGebra’s symbolic calculator to determine the peak or the maximum through the 1st derivative. The point or the abscissa found will represent the optimum.
Technical problems experienced
Ariane and I noted down a few technical problems we experienced during this activity that was well appreciated by the students who participated:
- It is essential to properly frame the video sequence. It is better to plan for more space than necessary. The football players who participated in the activity learned it the hard way by throwing the ball out of the frame while filming.
- It is important to limit the number of participants to make sure no one gets hit by a ball. In our case, we wanted to limit the number of registered people to 15 but due to the popularity of the activity, the college asked us to open it to 30 participants. We found ourselves somewhat cramped, but no one got hurt! Nevertheless, a more restricted number of participants would have allowed us to be more comfortable in the gymnasium used for the activity.
- If there are more than 4 or 5 teams to supervise, it is better to have multiple teachers. Indeed, students need support with the “technological” part of the activity and requests for help all come at once… Ariane’s role did not require her to know Tracker in detail, so we struggled to help all 30 people. Presenting a general demonstration as an introduction and providing links to software tutorials in advance could have facilitated the students’ learning.
- Not all students had downloaded Tracker before the activity. Those who hadn’t, used the online version of Tracker, but this version is much less efficient. Ask your students to download the software in advance to avoid wasting time.
- Some workshop participants i used a PC, some a Mac, and others a tablet. Dealing with all the different versions of Tracker was challenging (especially considering that the tablet version is much less effective). If all your students use the same type of device, you will save yourself some trouble!
- Practise analyzing videos with Tracker many times, to master the functionalities from every angle. Personally, I admit I hadn’t practised enough.
- Some students chose to analyze the motion of a Spikeball (rebounding ball). Unfortunately, its movement is too fast to be studied with Tracker.
- We had 2 hours to conduct the activity. We spent 30 minutes giving the instructions at the beginning, then the students spent about 1 hour performing and filming movements, and 30 minutes analyzing data at the end. Unfortunately, teams that encountered technical problems didn’t all have enough time to complete their analysis. Having 2.5 or 3 hours dedicated to the activity (even if some teams finish early!) would have been more optimal.
Students’ feedback
At the end, students shared their great appreciation for the activity during a group debriefing session. They discussed their process during the workshop. The session allowed all participants to realize the power of technological tools and mathematics for studying body movements. Notably, students from the Arts, Languages, and Communication program who had never done differential calculus and were unfamiliar with derivatives, loved seeing the practical use of mathematics. Student in the Science program aiming for fields such as kinesiology, physiotherapy, or sports medicine were also delighted to engage in an activity directly related to their areas of interest, as these fields are rarely addressed in college courses.
